
The problem is solved with the OLS regression model, REF, VIF, P values.
(To clarify: OLS= Ordinary Least Square, RFE = Recursive Feature elimination, VIF= Variance Inflation Factor)
Problem Statement and the Data
Data consists of various car features such as car name, fuel type, engine type, engine size, car body, car width, car length, etc.
The car company is new to the market. So, it wants to know which factors play a significant role in determining car price for this market demography. With this purpose in mind, I selected the top features from the data. Additionally, I have also modeled the price of cars with the available independent variables.
Approach to solve the problem
Data Cleaning and Preparing

- Separated company name (Audi, BMW etc) from model name (Audi 5000s,BMW 500i etc).
- Combined multiple names with the same meaning.
- Converted number spelling (datatype:object) to numbers (datatype:integer)
- Converted categorical data into numerical data (One-hot encoding)
Model Building:
- Scaled the data with StandardScaler utility class from sklearn.preprocessing package.
- Selected top 15 features with RFE from sklearn.feature_selection.
- With these 15 features, I built an OLS model by module statsmodel.api
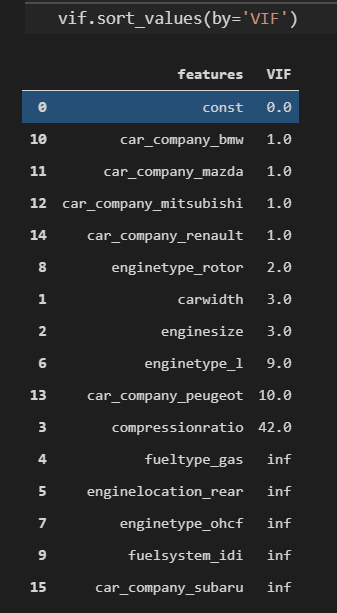
- After building the model, I checked P-values and VIF values.
- VIF is used to detect correlation among the features. When some features are highly dependant on each other, we may face difficulties in distinguishing their individual effects on dependant variable (here, price of the car). In other words, the Higher the VIF value, the higher the correlation.
- So, VIF should be less than 5. (P-value should be 0.05)
- From 15 features, 5 values were infinite, one of them was 42.0.
- So, I decided to select the top 10 features.
- Then, I repeated the above steps with 10 features.
- Removed one feature. Build OLSL model again. Checked P-values and VIF values.
- Obviously, all the features could not pass my p-value and VIF value criteria.
- So I dropped one feature.
- I repeated the above steps till I got the desired results.
The image below shows the last 6 features and their p-values and R2 value.
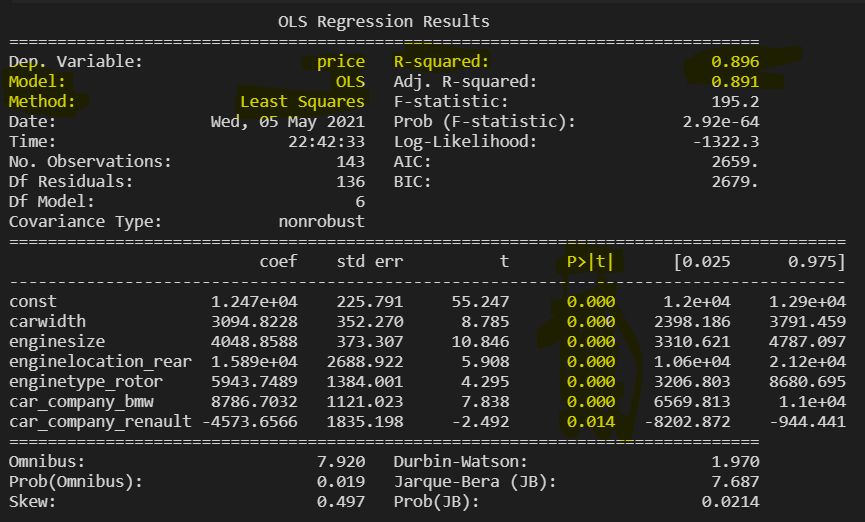
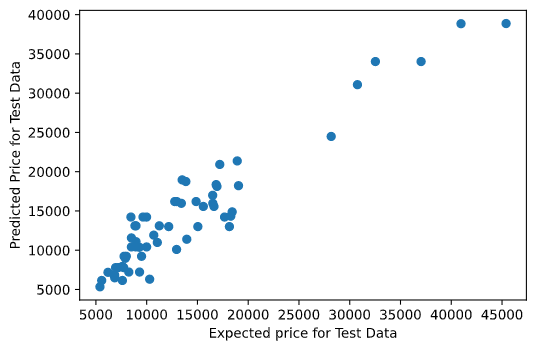
These 6 features were playing a significant role in determining the price of the car. Based on these features, I have predicted test data. The graph below compares the expected and predicted price for test data. R2 score is 0.899 when crosschecking with sklearn.
Howdy! This is my first visit to your blog! We are a team of volunteers and starting a new initiative in a community
in the same niche. Your blog provided us useful information to work on. You have done a outstanding job!
Every weekend i used to pay a quick visit this site, because i wish for enjoyment, as
this this site conations really fastidious funny material too.
Helpful information. Lucky me I discovered your website by chance, and I am shocked why this coincidence did not took place earlier!
I bookmarked it.